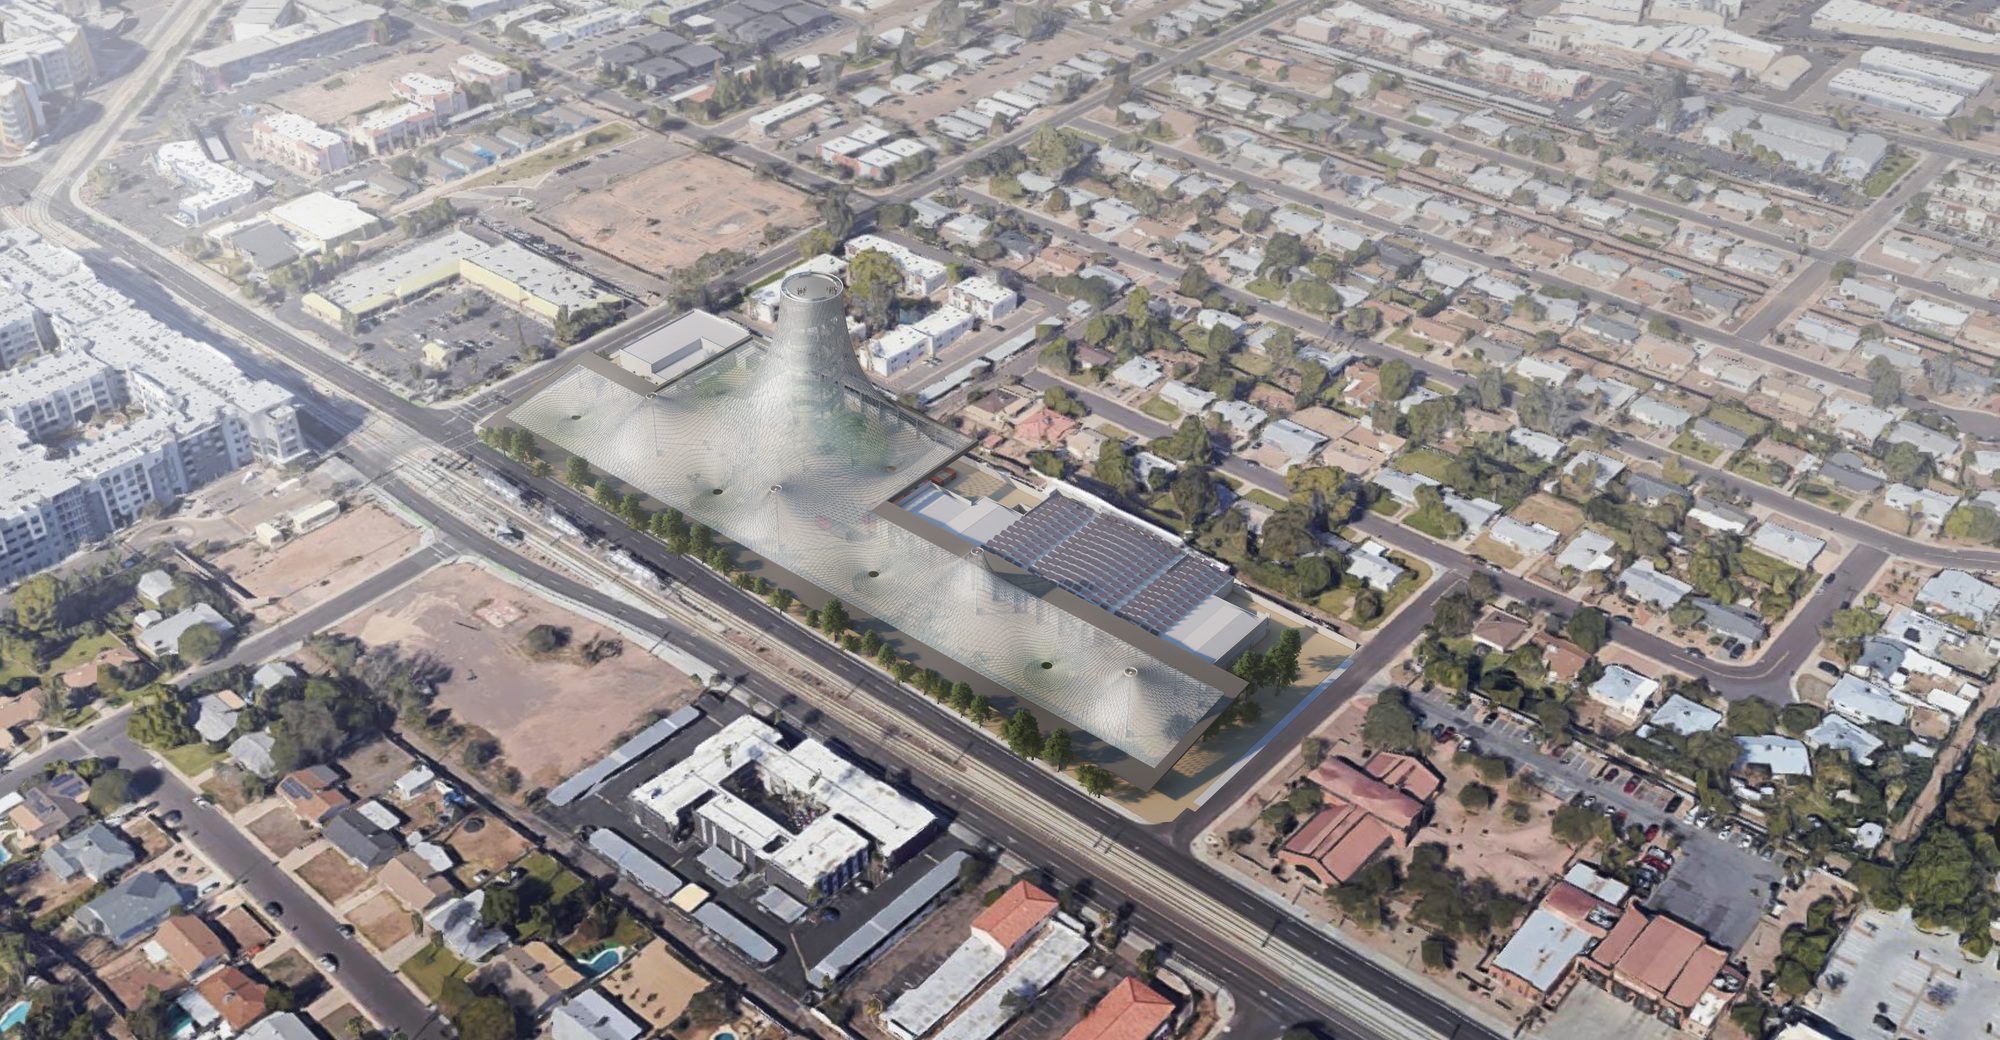
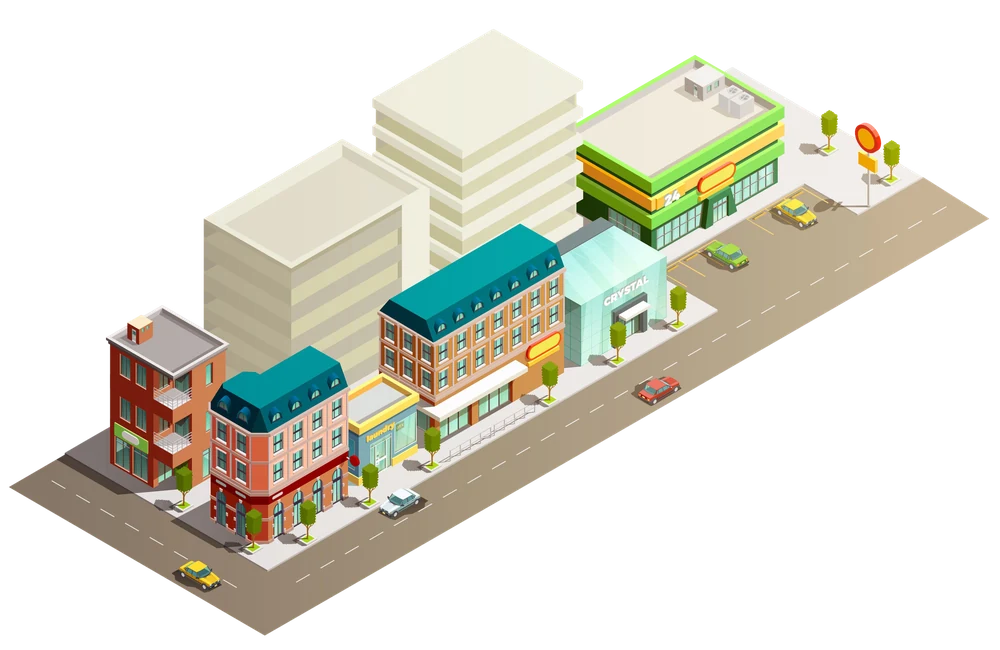
Aerial view of a city neighbourhood regenerated around a transformation facility
Urban regeneration · concept render

transforming waste into value

Cardboard isn’t waste. It’s a resource, and a new business model for cities.

US boxes / year100bn
Landfilled56%
Missed opportunity$4bn
The concept

A circular economy model for cardboard.

Transformd is a proposal to re-use and re-cycle cardboard, a valuable and underrated resource, through a new, advantageous business model: cardboard is collected and recycled into new products useful to the local community and beyond. The same service, city by city, starting in California and Arizona.

Why it’s different

Recycling moves cardboard away. Transformd keeps its value here.

Most recovered cardboard is baled and shipped out of the region as a commodity. We remake it locally, so the products, the jobs and the data stay in the city that produced it.

Recycling today

Collected, then gone

  1. Collected, often mixed and contaminated
  2. Baled at a recycling facility
  3. Shipped out of the region
  4. Sold as commodity fibre
  5. The value leaves the city
With transformd

Collected, then remade

  1. Collected by residents, stores and the city
  2. Tracked in the app, every pound
  3. Transformed in a local facility
  4. Sold back to local business as new products
  5. Value, jobs and data stay local

The crisis

The world is experiencing an unprecedented materials crisis. Every year billions of tons of waste with recoverable, reusable materials are discarded, and only a fraction goes back into the production cycle.

Our answer

Harnessing urban mining from a design perspective: transforming waste into a circular resource through material innovation.

Cardboard: the opportunity

A missed opportunity, in numbers.

The rise of e-commerce is the main driver of demand for cardboard. Most of it is buried, not reused.

Cardboard boxes produced in the US

Source: Capcity Recycling
100 billion / year

and 13 billion boxes delivered to US doors every year.
Cardboard life after collection

Source: NREL, 2023
56% Landfilled 38% Recycled 6% Burnt

The missed opportunity

Source: NREL · 68 million tons a year lost into landfills
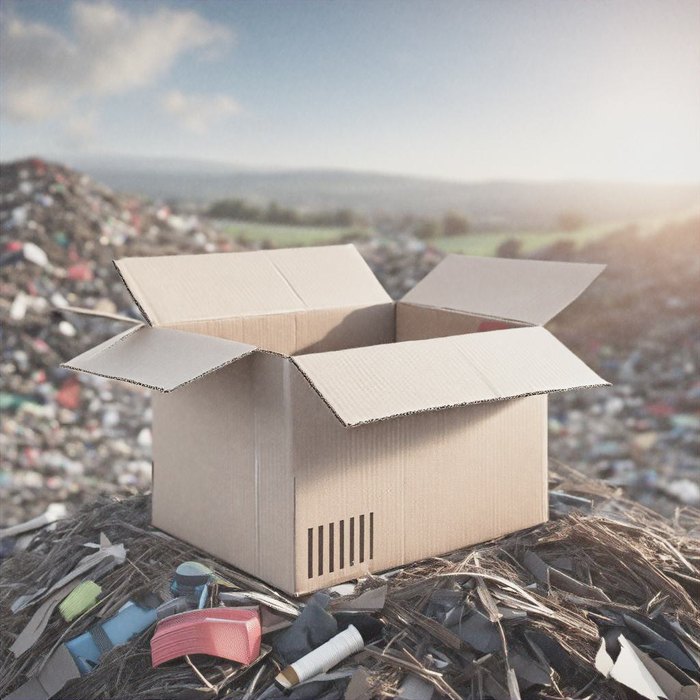
A cardboard box on a landfill56%
$4bnmissed opportunity, every year

2024–2029 global e-commerce, $bn

Source: Statista · 9.49% CAGR

Cardboard is a valuable resource

Paper & paperboard packaging · Precedence Research (global), Stellar Market Research (USA)
Global · 2022 → 20324.80% CAGR
USD 421.5bnUSD 670.38bn
USA · 2023 → 20303.56% CAGR
USD 48.14bnUSD 67.74bn

What one new ton of cardboard costs, and what recycling saves

Per ton produced
17trees cut for a new ton
900 kgCO₂ emitted for a new ton
75%energy saved by recycling, plus 450 kg CO₂
7,000 galwater saved by recycling
Where we start

Two states. One model.

The service is the same in every city: collect, transform, distribute locally. We start where cardboard volumes and partners are strongest.

California total loss$165M

lost economic value each year: $66M + $70M + $29M

E-commerce boxes / year853M

345M + 361M + 147M packages

The opportunity~$466M

$192.4M + $194M + ~$80M in new products and services
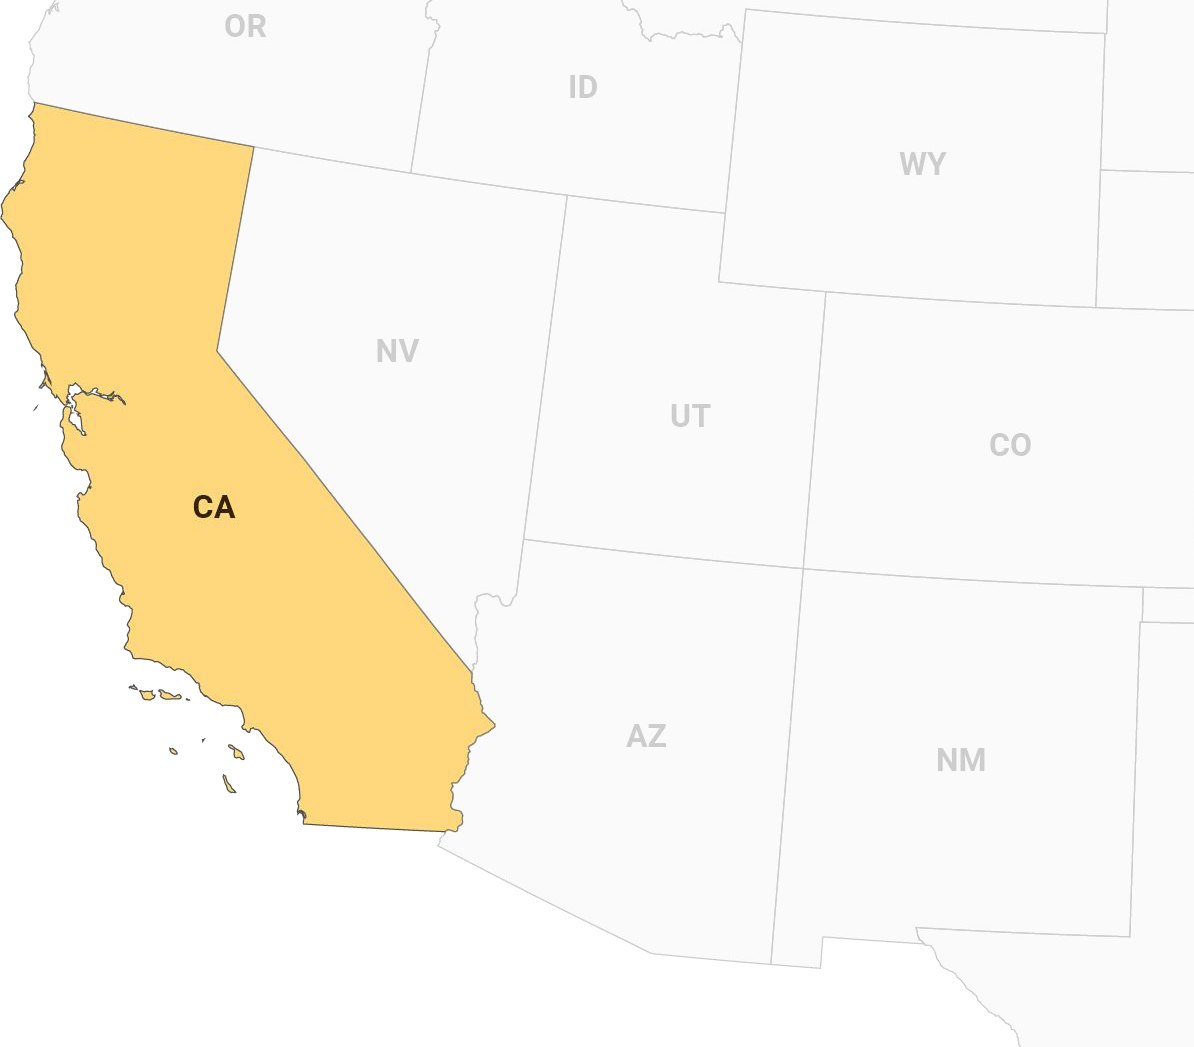
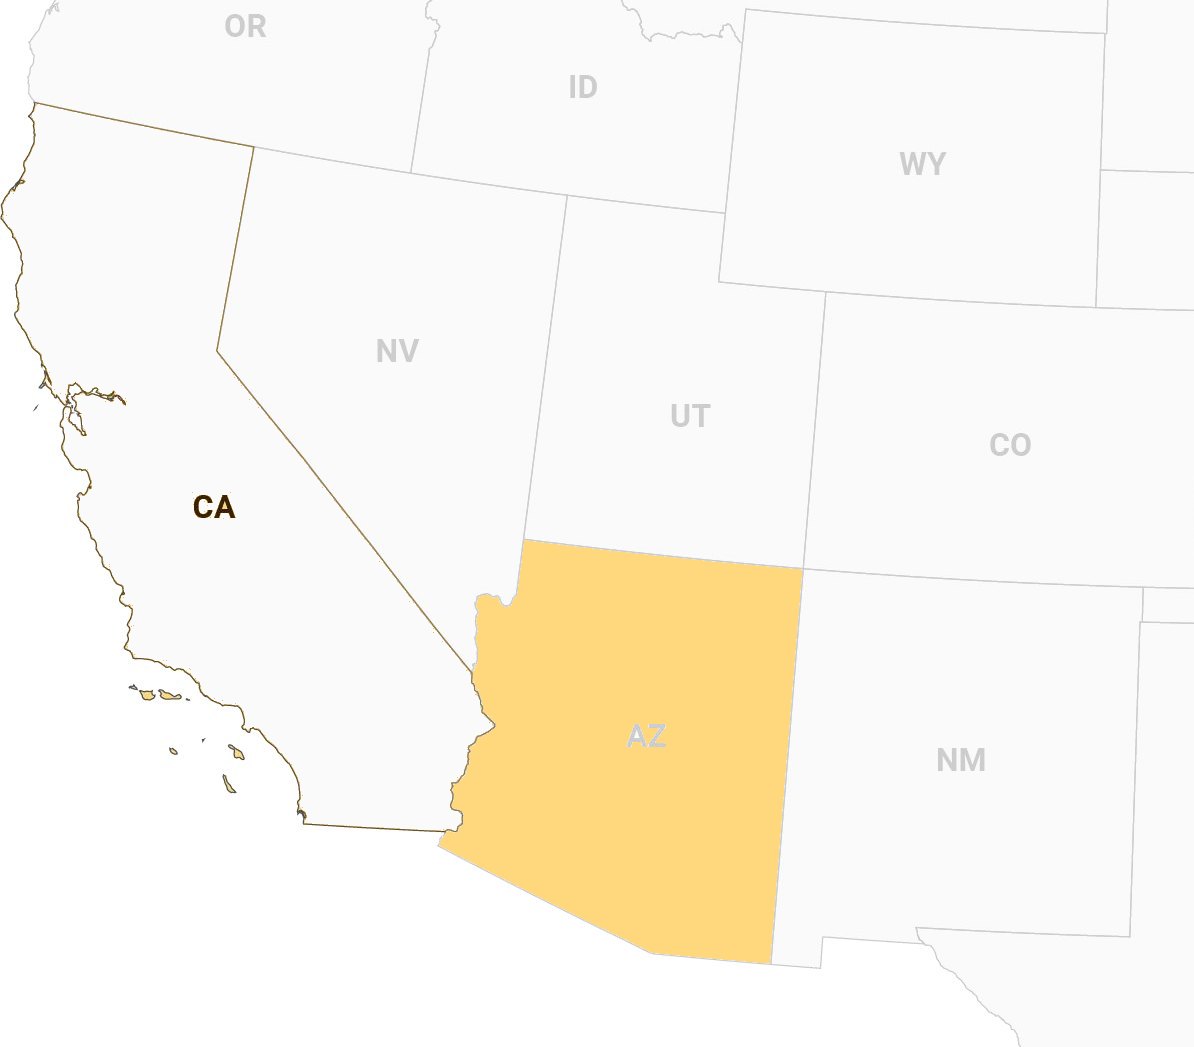
Map of the western United States with California highlightedSan Francisco Bay AreaLos Angeles CountySan Diego County

The opportunity: San Francisco Bay Area

345 million packages a year. Los Angeles County follows the same model (821k MT of bulk overage) for $194M.

Bulk overage · 800k MT @ $77$61.6M
Local advertising · $0.10 / unit$60M
Food cartons · $0.20 / unit$39M
Local carton tax · $0.10 / unit$19.8M
Grocery bags · $0.03 / unit$12M
Total$192.4M
RegionPopulationHouseholdsBoxes / yearPer householdLost todayOpportunity
San Francisco Bay Area9.7M~3.73M~345M~93$66M$192.4M
Los Angeles County~10.15M~3.63M~361M~100$70M$194M
San Diego County3,269,973~1,149,157~147M~128$29M~$80M

Sources: california-demographics.com, worldpopulationreview.com, abag.ca.gov forecasts, fexe.com e-commerce fulfillment data.

The transformd ecosystem

Three parts, one ecosystem.

The city’s recycling service app: find collection points on a map, book a pick-up, track it, and get rewarded. Household and neighbourhood scorecards show the impact, and friendly challenges between neighbourhoods keep people coming back.

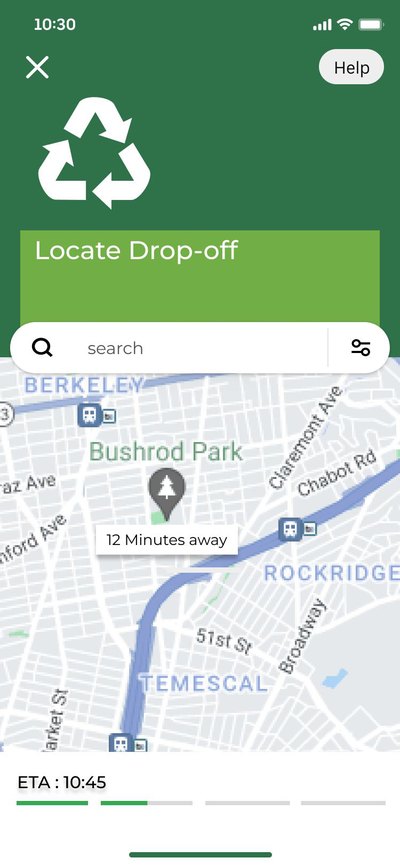
  • Locate drop-off
  • Book a pick-up
  • Scorecards
  • Neighbourhood challenges
  • Rewards

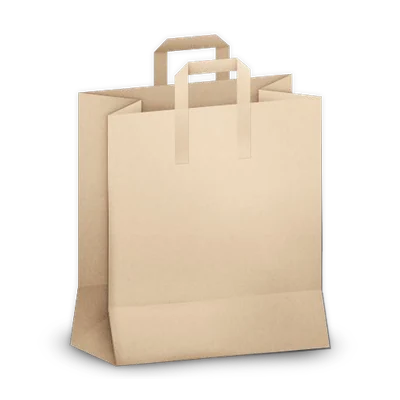
In the transformation facility, cardboard becomes new products useful to the local community and beyond: paper bags, food cartons, cups and packaging.

  • Grocery bags
  • Food cartons
  • Cups
  • New packaging

A design challenge with universities and corporate partners that generates new concepts, products and materials.

  • Universities
  • Municipalities
  • Businesses
  • Press & media
Service journey

From e-commerce delivery to new products on the shelf.

Collection, zero-emission transport, transformation and clean local distribution. Then the cycle can restart.
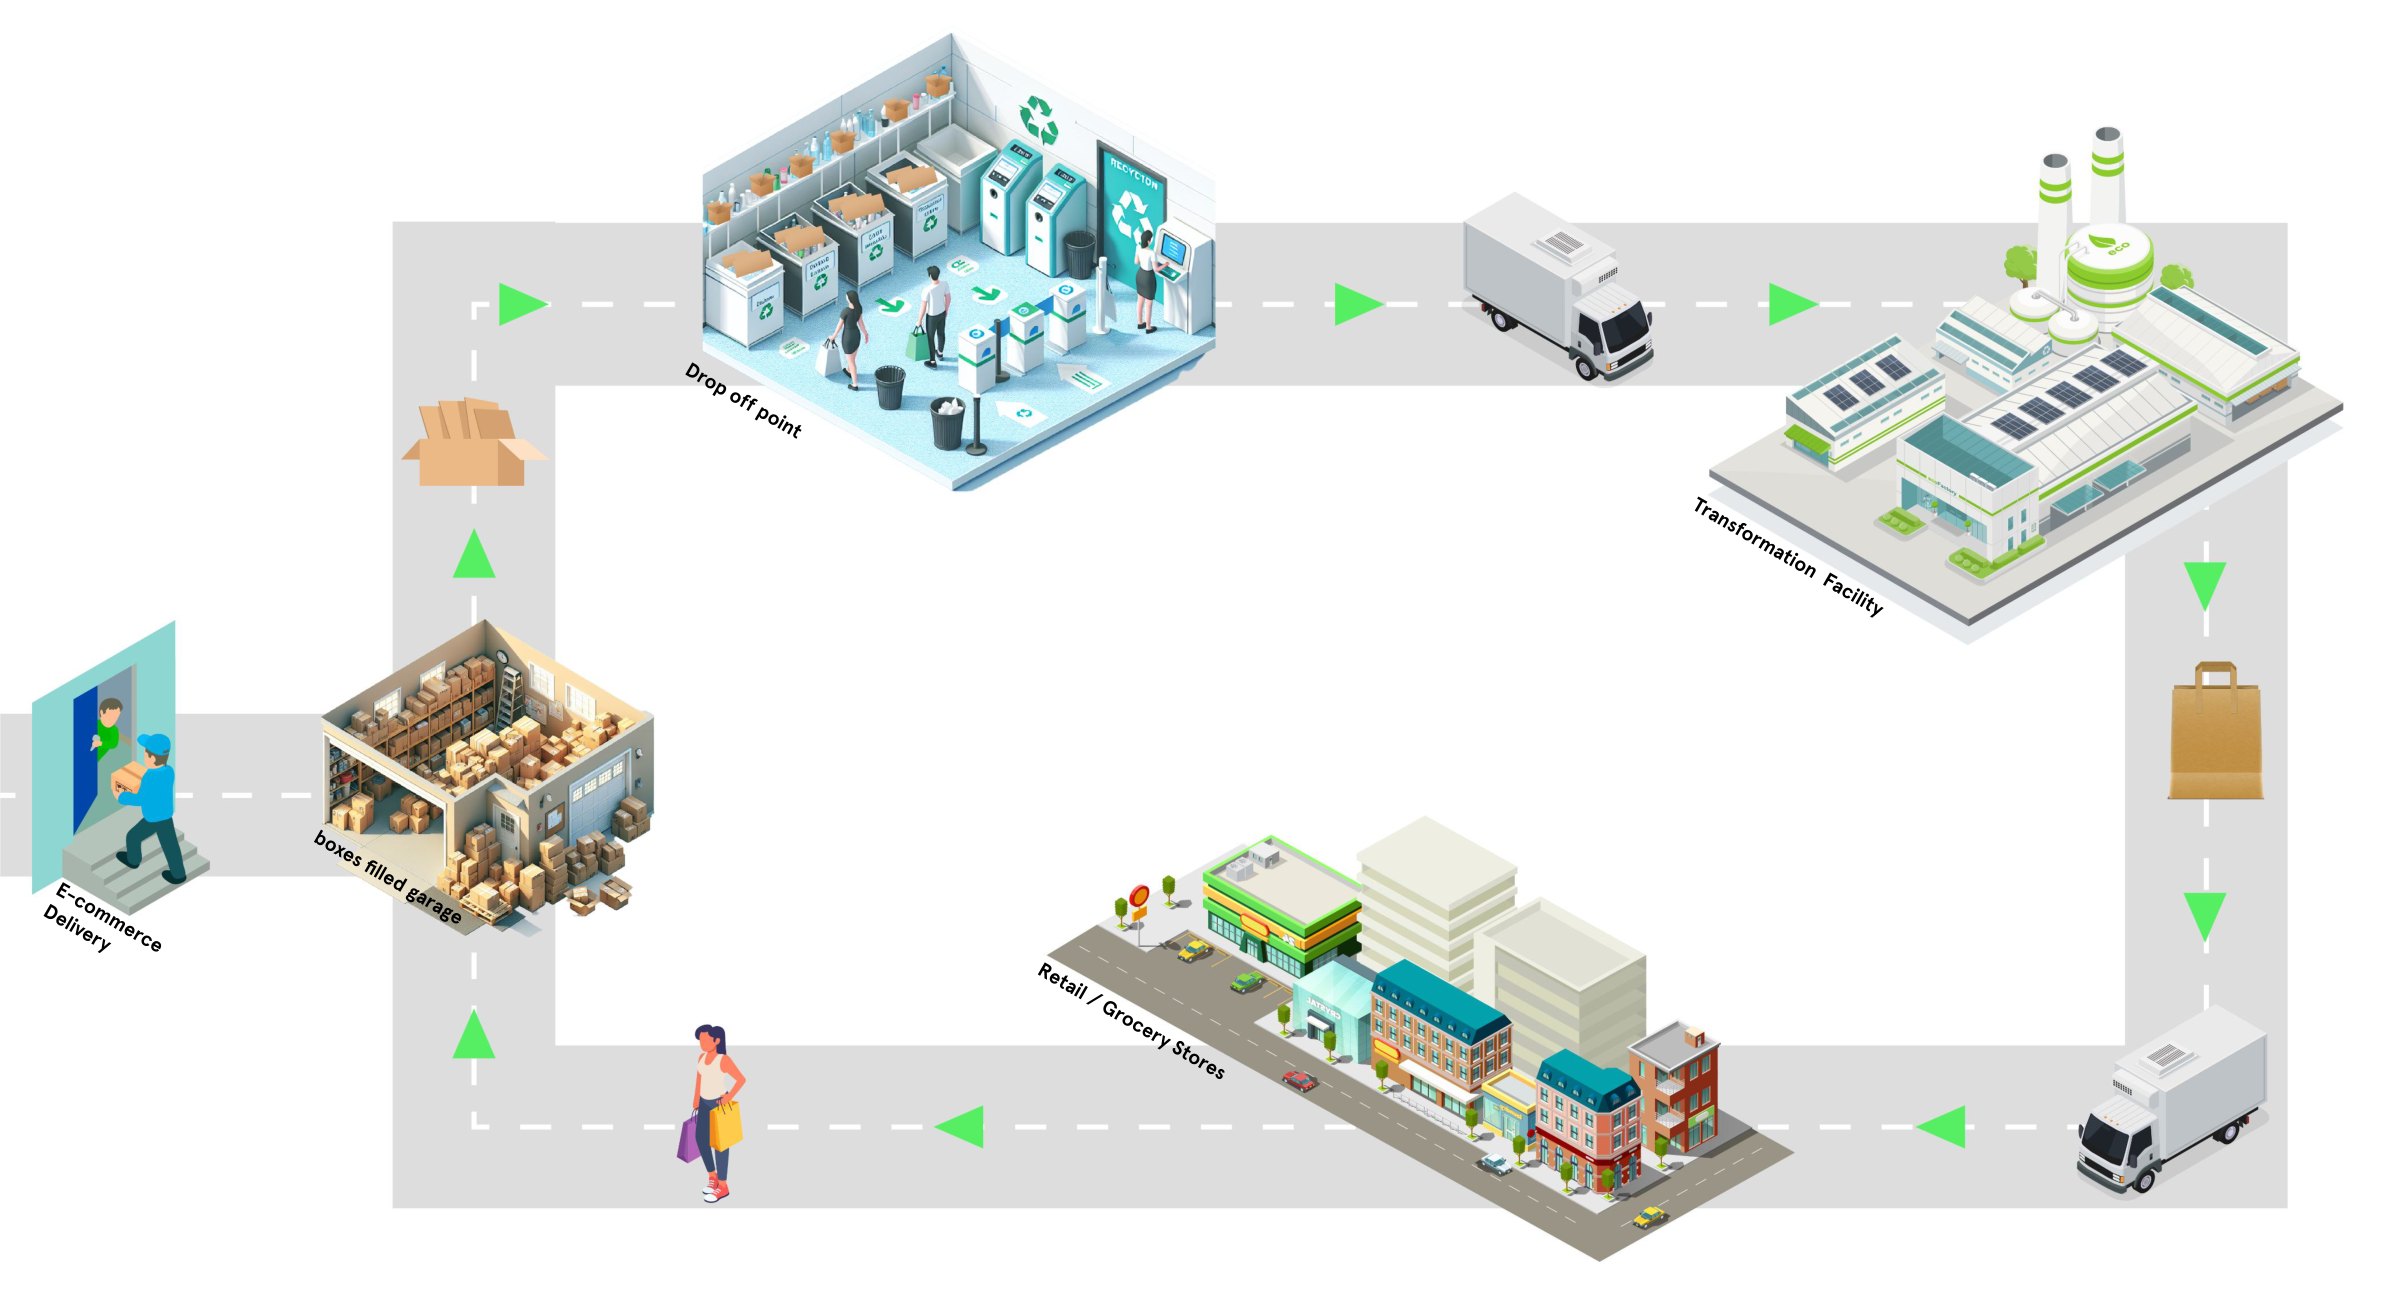
Isometric service journey: e-commerce delivery, a garage full of boxes, the drop-off point, a truck to the transformation facility, paper bags, a truck to retail and grocery stores, and a shopper
  1. 01

    E-commerce delivery

    Boxes arrive at homes and stores every day.
  2. 02

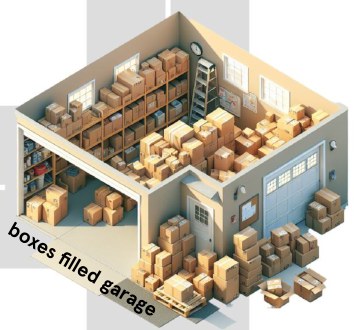
    Boxes fill the garage

    Cardboard piles up. People want to recycle it but don’t know how.
  3. 03

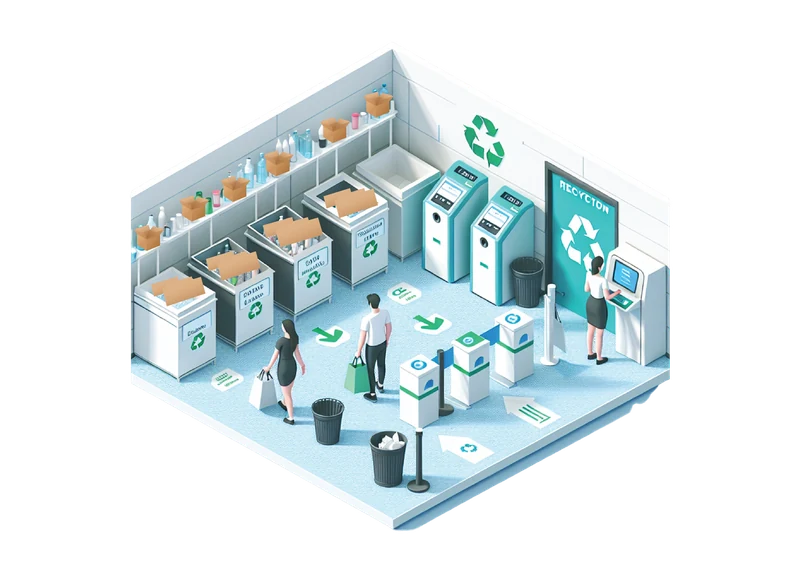
    Drop-off point

    A collection point with a reward program, or a pick-up from the door or store.
  4. 04

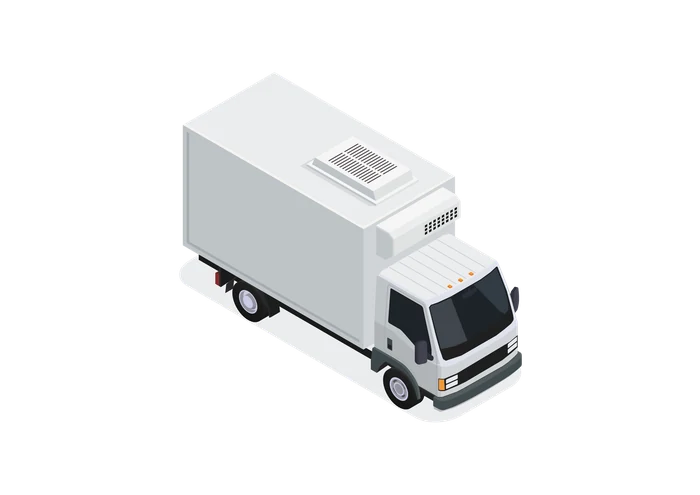
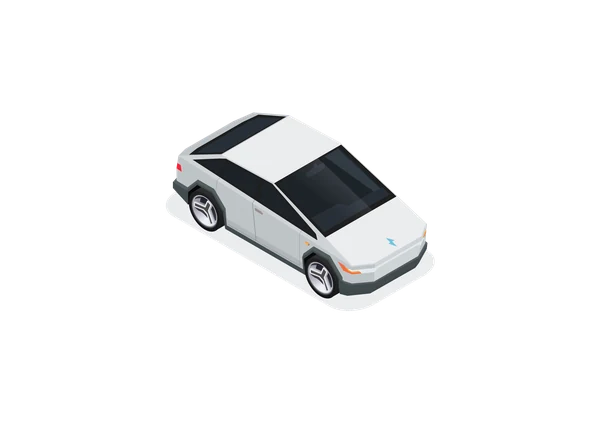
    Zero-emission transport

    Flattened cardboard travels to the transformation facility.
  5. 05

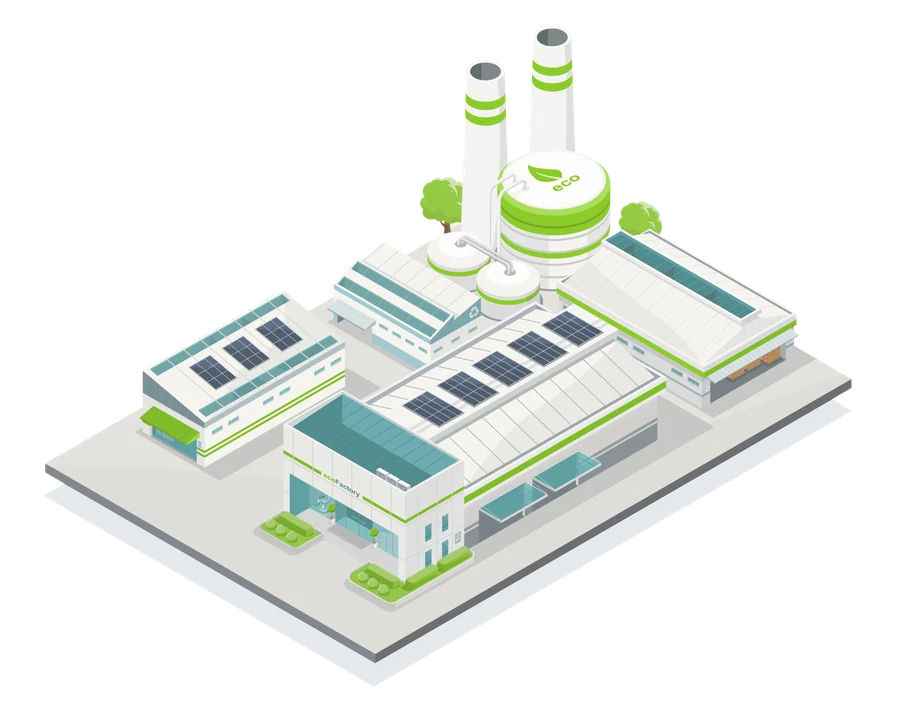
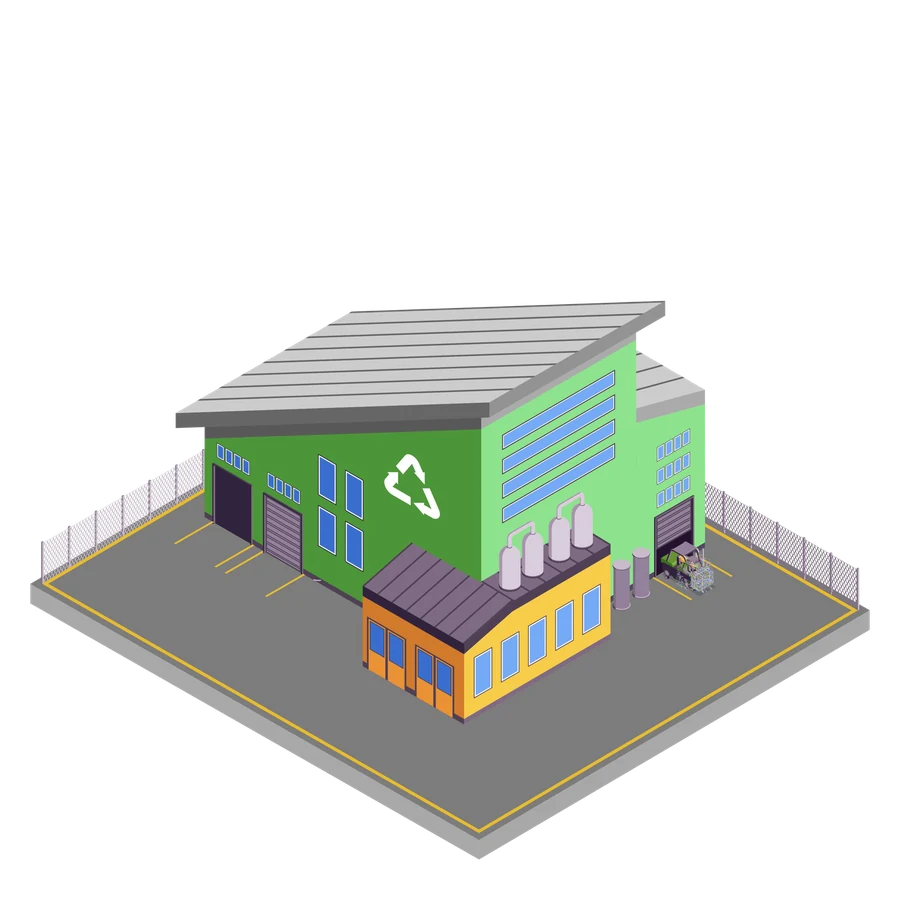
    Transformation facility

    Created in abandoned or disused buildings: urban regeneration, social impact and new jobs.
  6. 06

    New products

    Paper bags, food containers, cups and packaging, ready for local business.
  7. 07

    Retail & grocery stores

    Clean distribution to local retailers, grocery stores and restaurants.

  8. 08

    Back to the customer

    Recycled products are used for new packaging and single-use food containers.

The cycle can restart
Pick-up options

Three ways cardboard reaches the transformation facility.

Retail, community and municipal streams, all tracked in one dashboard.
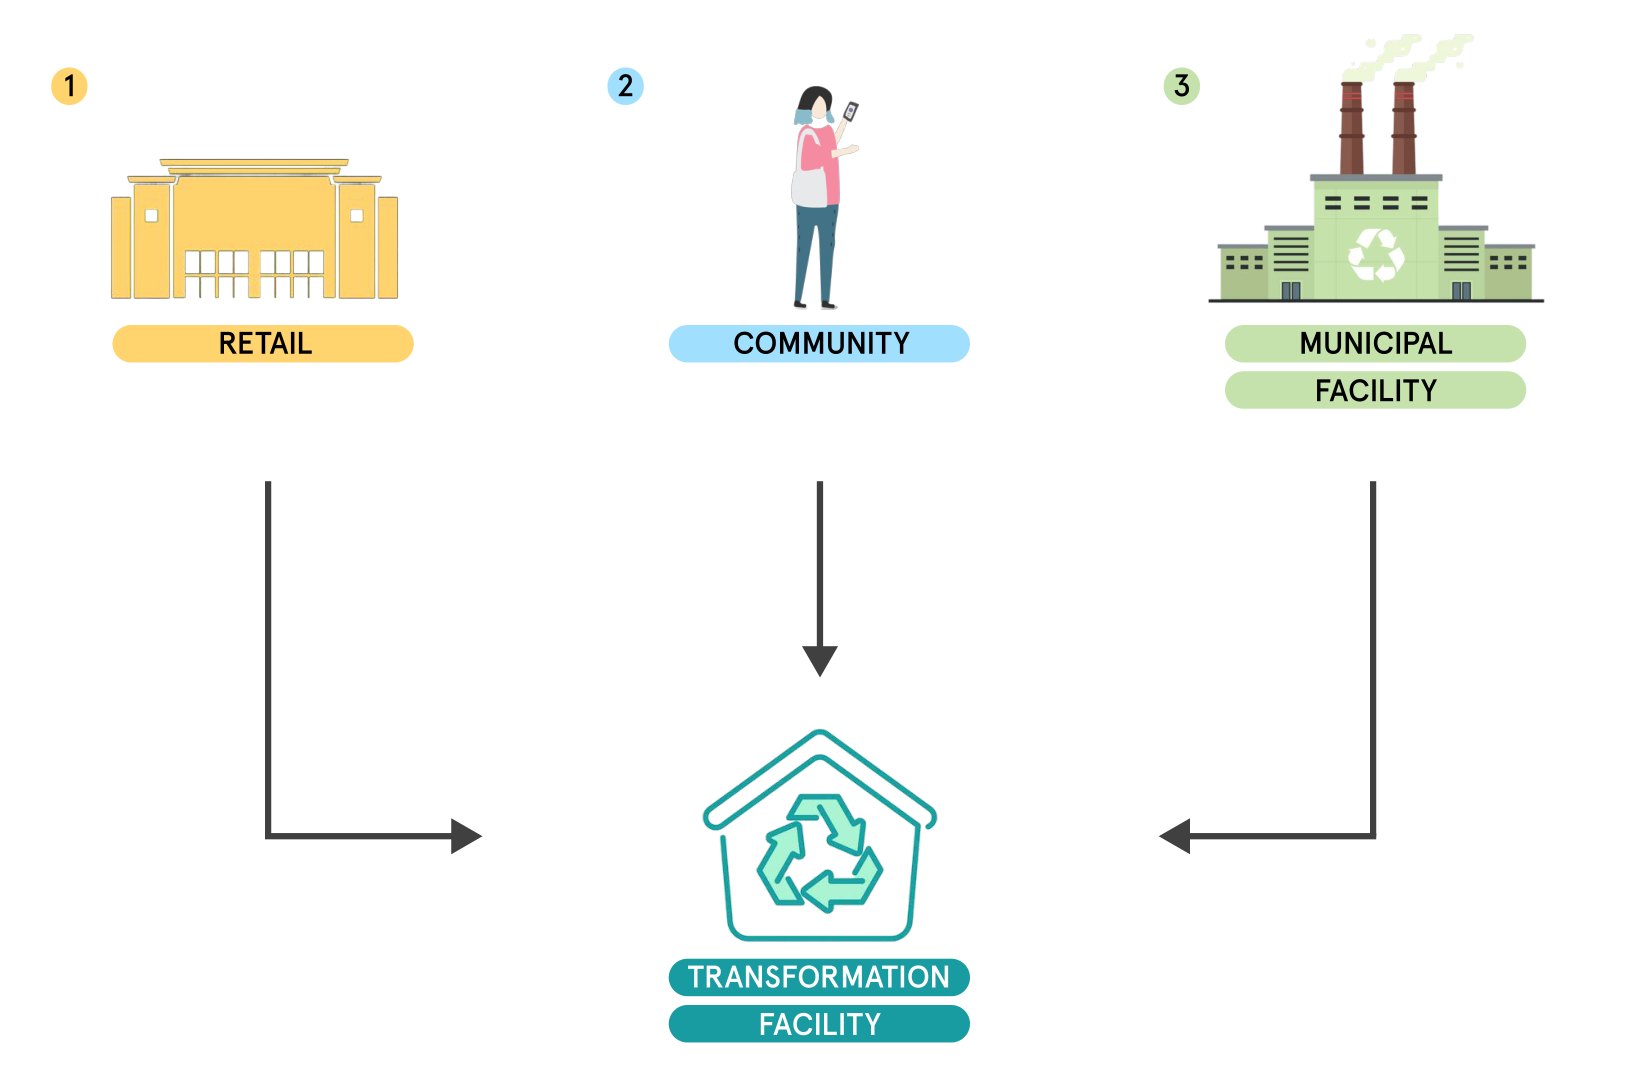
Pick-up options: retail, community and municipal facility, all feeding the transformation facility
1

Retail

Proactive: a free service to relieve the cardboard problem for retail stores.

2

Community

Community contribution through the app and community drop-off bins.

3

Municipal facility

Pick-up from the municipality’s recycling centre.
1Pick-up scenario 1 / proactive

A free service to relieve the cardboard problem for retail stores.

Who picks up

Gig worker
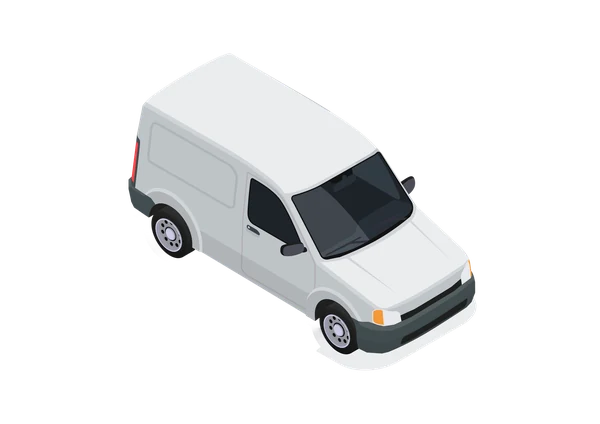
Man in a van
Removal company

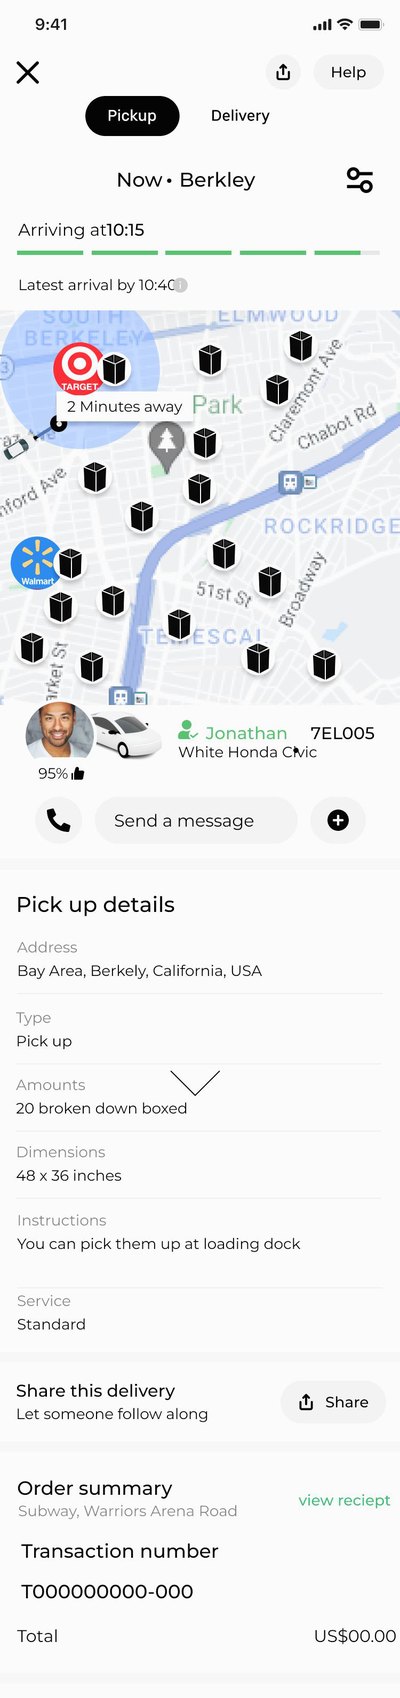
In the app

Track order screenTrack order
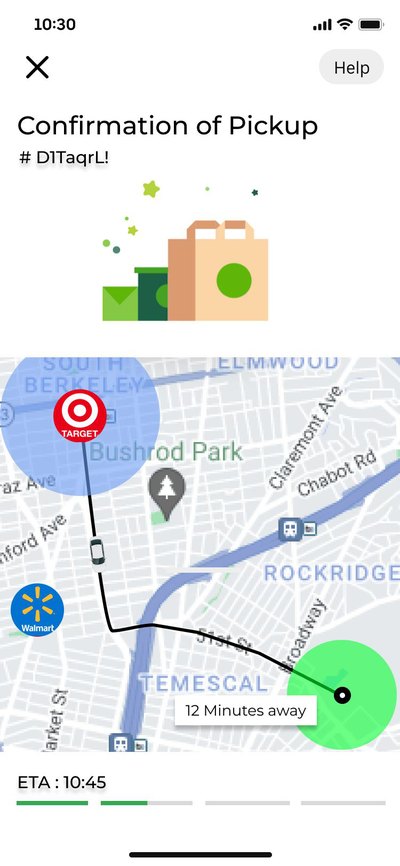
Pick-up confirmation screenPick-up confirmation

The route

Big box retail / grocery stores
→
Transformation facility

Stores hand over their cardboard for free; it comes back as paper bags for their shelves.
2Pick-up scenario 2 / community contribution

Emily’s story.

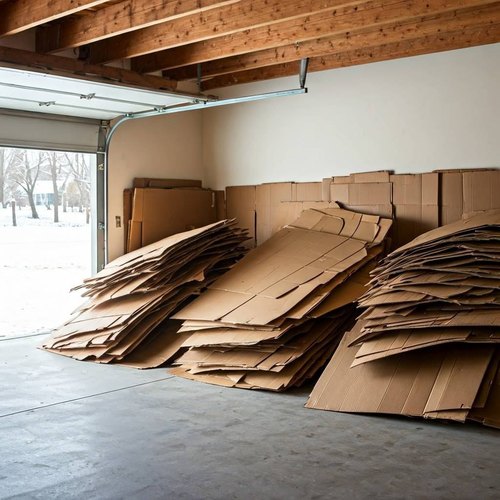
ChaosA garage filled with flattened cardboard
Emily has a garage filled with cardboard.
FrustrationEmily tying up cardboard
She needs to recycle it but doesn’t know how.
DiscoveryEmily looking at her phone
On social media she finds the city has a recycling service app.
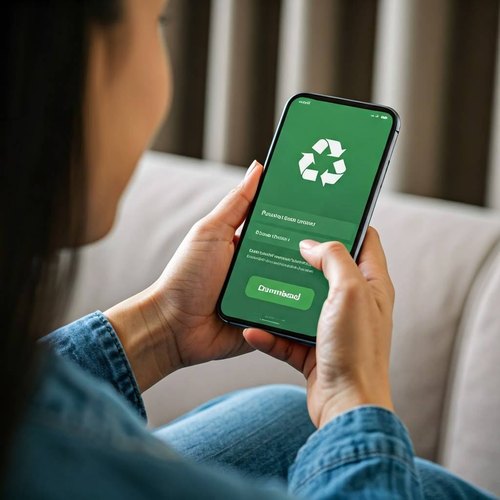
EngageHands holding a phone showing the recycling app
She downloads the app and finds several great features.
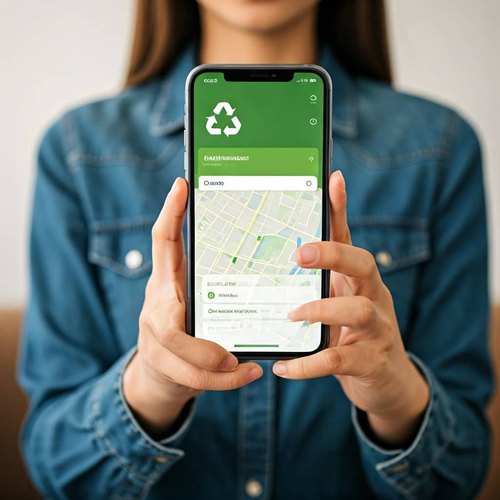
ContributeEmily showing the collection point map
A map shows collection points in her area.
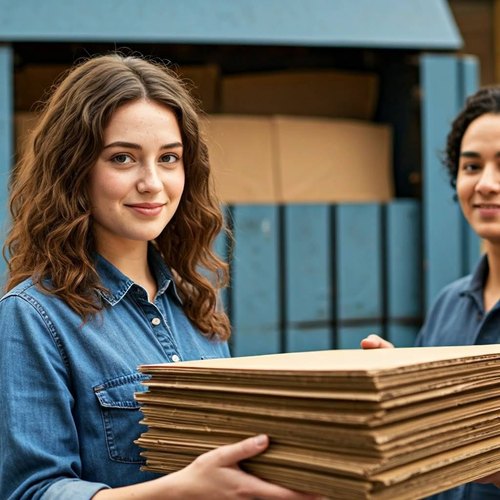
SuccessEmily carrying cardboard to the collection point
At the collection point, turning in cardboard is simple.

The Transformd app

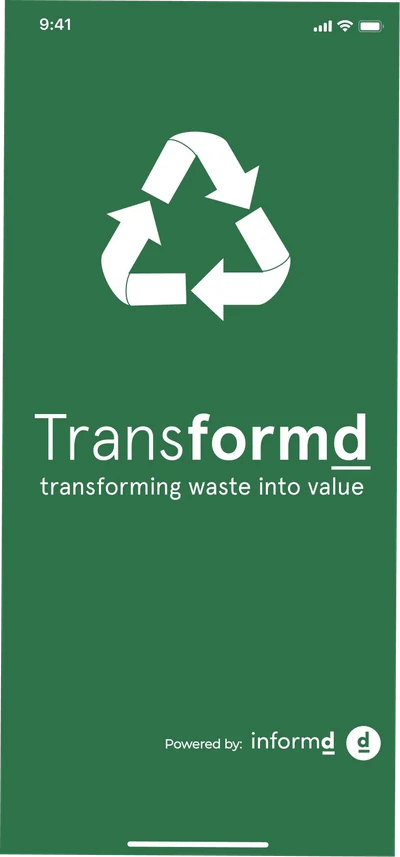
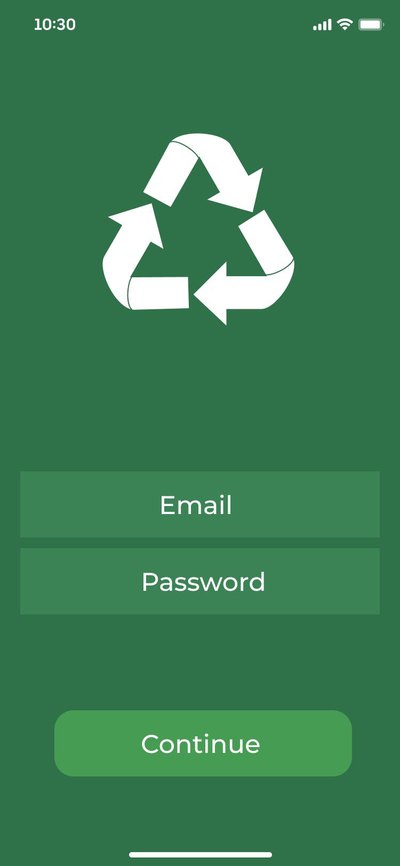
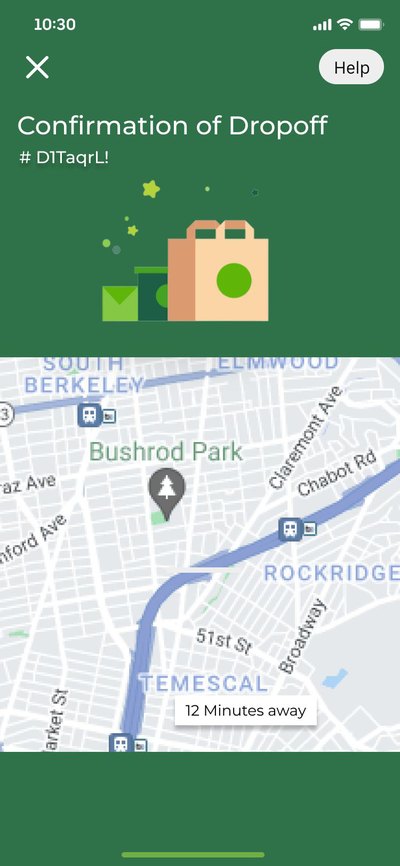
Transformd app splash screen Sign-in screen Locate drop-off map screen Drop-off confirmation screen

Community drop-off bin

Isometric community drop-off point with sorting bins and kiosks

Every contribution is recorded and rewarded, then collected for the transformation facility.
3Pick-up scenario 3 / from recycling center

From the municipality’s recycling facility.

Municipality recycling facility
→
Service truck
→
Transformation facility

Pain relief

  • Reduction of material loss
  • Reduction of CO₂ emissions
  • Reduction of resource time

Gain

  • Better sustainable management
  • New revenue stream
  • Better community engagement
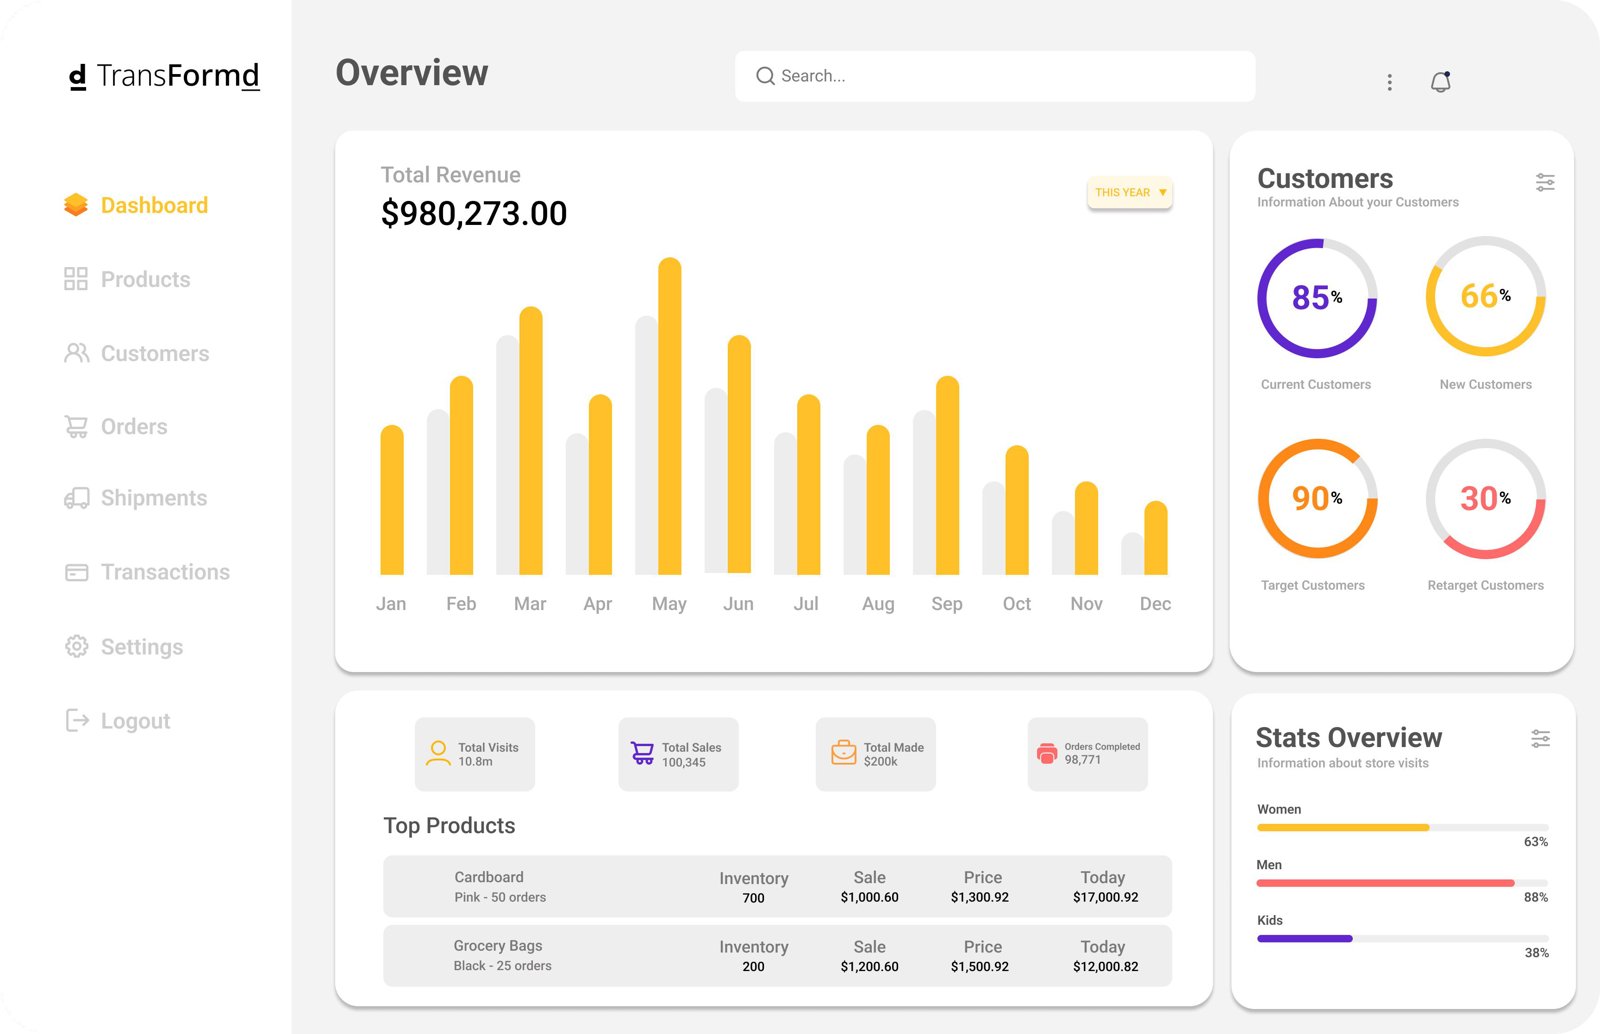
Transformd tracking dashboard with collection volumes, customers and impact charts
Impact dashboard

Every pound tracked, every neighbourhood counted.

One platform behind every pick-up scenario, with impact reporting built in.

Cities · diversion and contamination by zip codeStores · orders, pick-ups and volumesResidents · personal and neighbourhood scorecards
  • Pounds diverted
  • CO₂ avoided
  • Energy & water saved
  • Participation by zip code
  • Neighbourhood rankings
  • Contamination tracking
Benefits

Economic value and social impact value.

For municipalities, local businesses and the community.

Financial benefits

Benefits for municipalities, local businesses and the community.
Urban regeneration

Regenerating less cared-for neighbourhoods, allowing social, architectural and cultural rebirth.
Waste reduction

Less cardboard going to landfill means less CO₂.

Energy conservation

Recycling one ton saves 75% energy, 450 kg of CO₂ and 7,000 gallons of water.
Material flow optimization

Fewer fibres lost. More energy conserved.

Circular economy

Materials and profits circulate at a local level, helping sustain local communities and businesses.

Business model

A new, advantageous business model.

Citizens and businesses get more sustainable practices; local businesses cut the cost of buying paper packaging.

Key partners

  • Local community
  • Local businesses
  • Public institutions
  • Recycling collection companies

Key activities

  • Gathering cardboard boxes
  • Transport to collection points
  • Pick-up by municipality or third parties
  • Transport to the recycling centre
  • Producing new paper packaging and boxes
  • Distribution to local business

Value proposition

  • More sustainable practices for citizens and businesses
  • Circular economy practices that benefit all and the environment
  • Helping businesses cut packaging costs
  • Urban regeneration
  • Job creation
  • Distribution to local businesses
  • Helping citizens dispose of large amounts of cardboard

Customer relationships

  • Cooperation with the community
  • Keeping engagement a high priority

Customer segments

  • Citizens
  • Business owners

Key resources

  • Recycling facilities
  • Collection services
  • Distribution service for products
  • Strategy for rewarding citizens

Channels

  • Collection services
  • Distribution service
  • Digital and physical awareness campaigns

Revenue streams

  • Sale of recycled cardboard boxes and other paper packaging
  • Possible grants from the CalRecycle program
  • Working towards the 2030 emission-reduction and 2050 zero-emission plans
  • A healthier environment for citizens

Cost structure

  • Creating or expanding recycling facilities
  • Collection point bins
  • People and vehicles for pick-up, or a third-party contractor
  • Distribution of new products
  • Digital and physical advertising for awareness
University challenge

Universities, cities and business, designing together.

An introduction to mixed-methods research, service and systems design, and critical thinking, as students work through their problem and opportunity space.
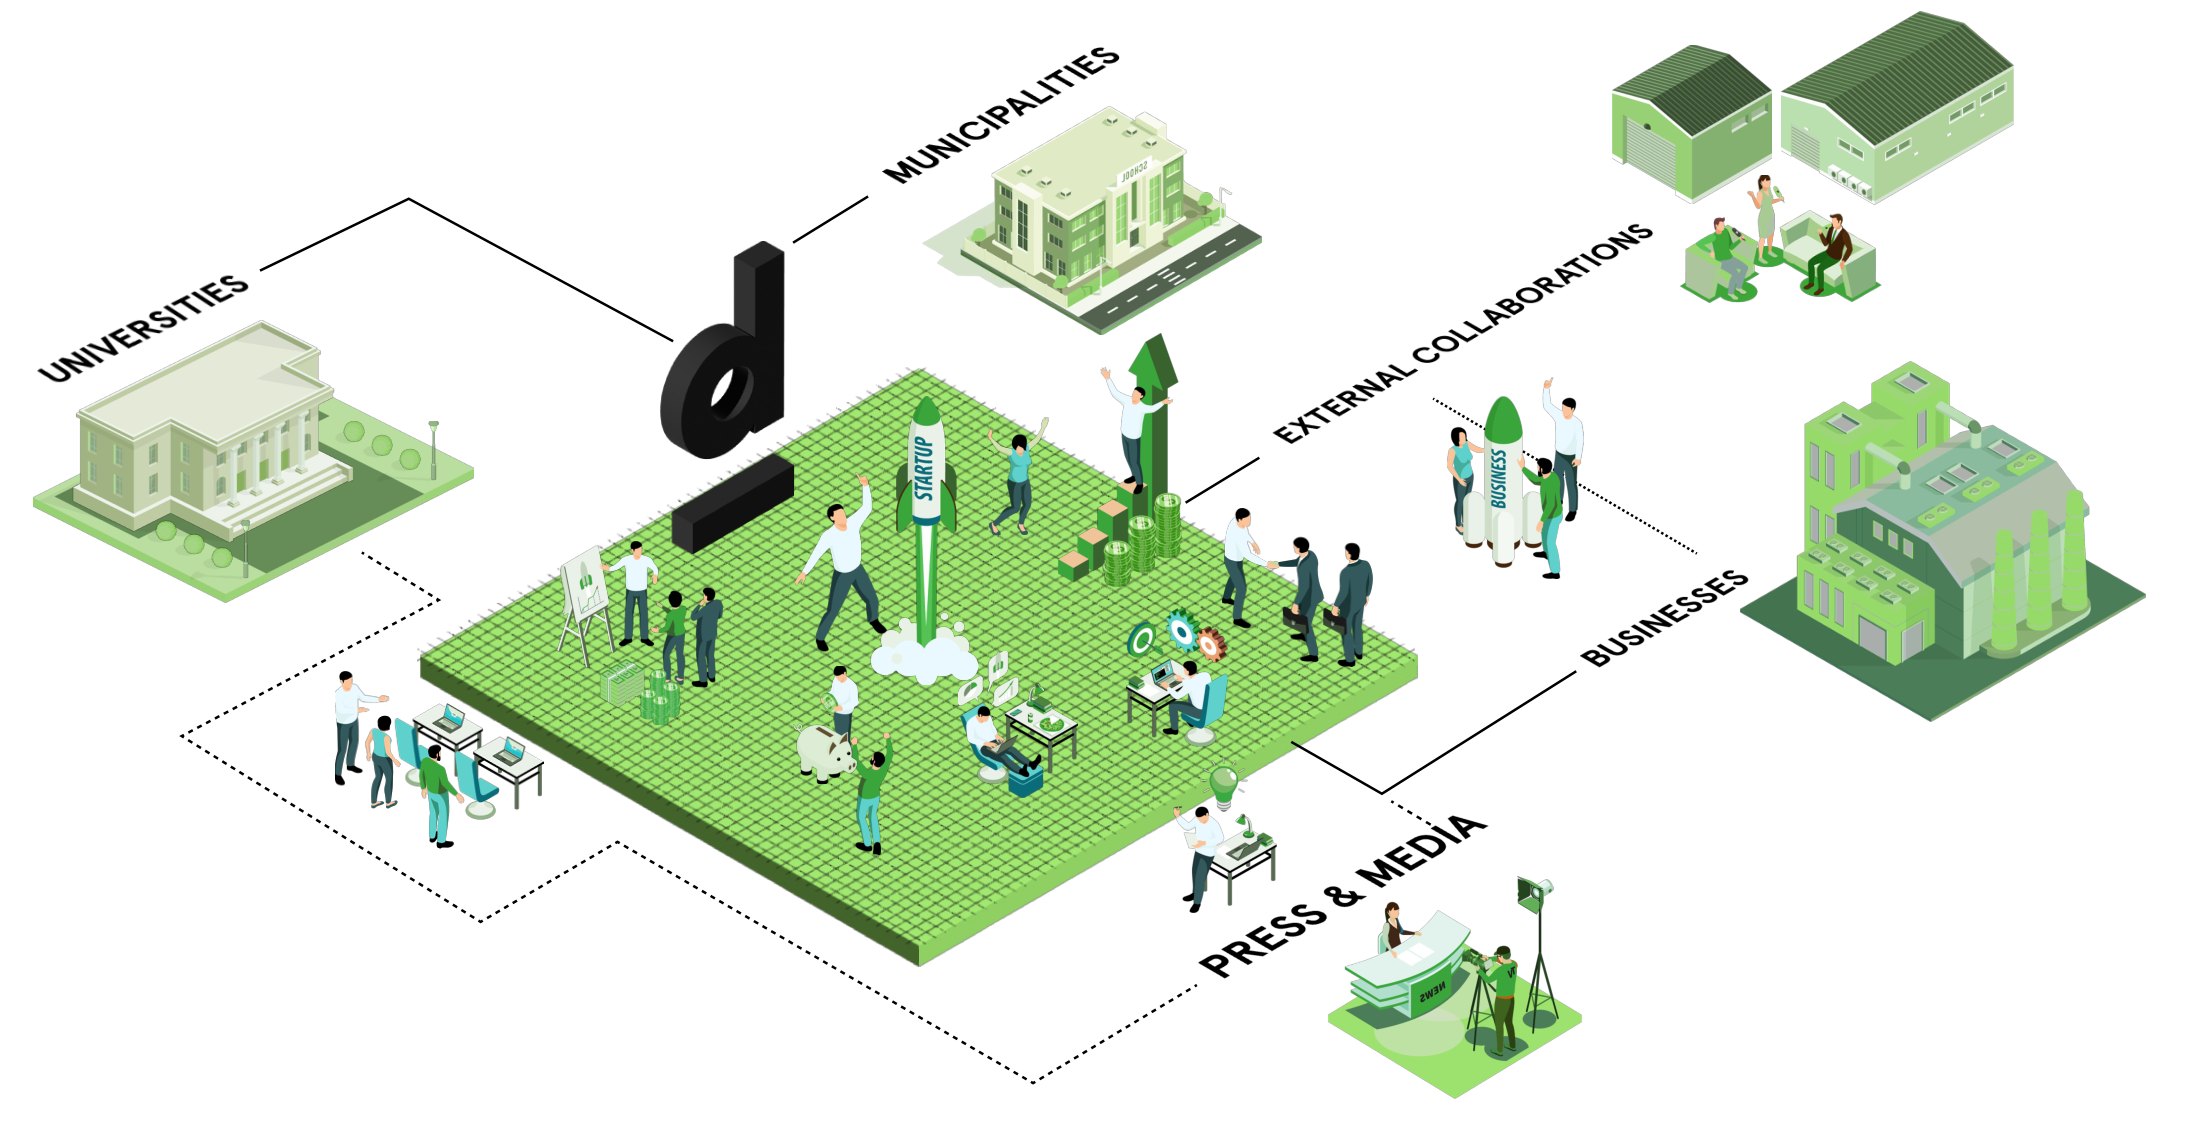
Isometric university challenge ecosystem linking universities, municipalities, external collaborations, businesses and press and media around a startup launch
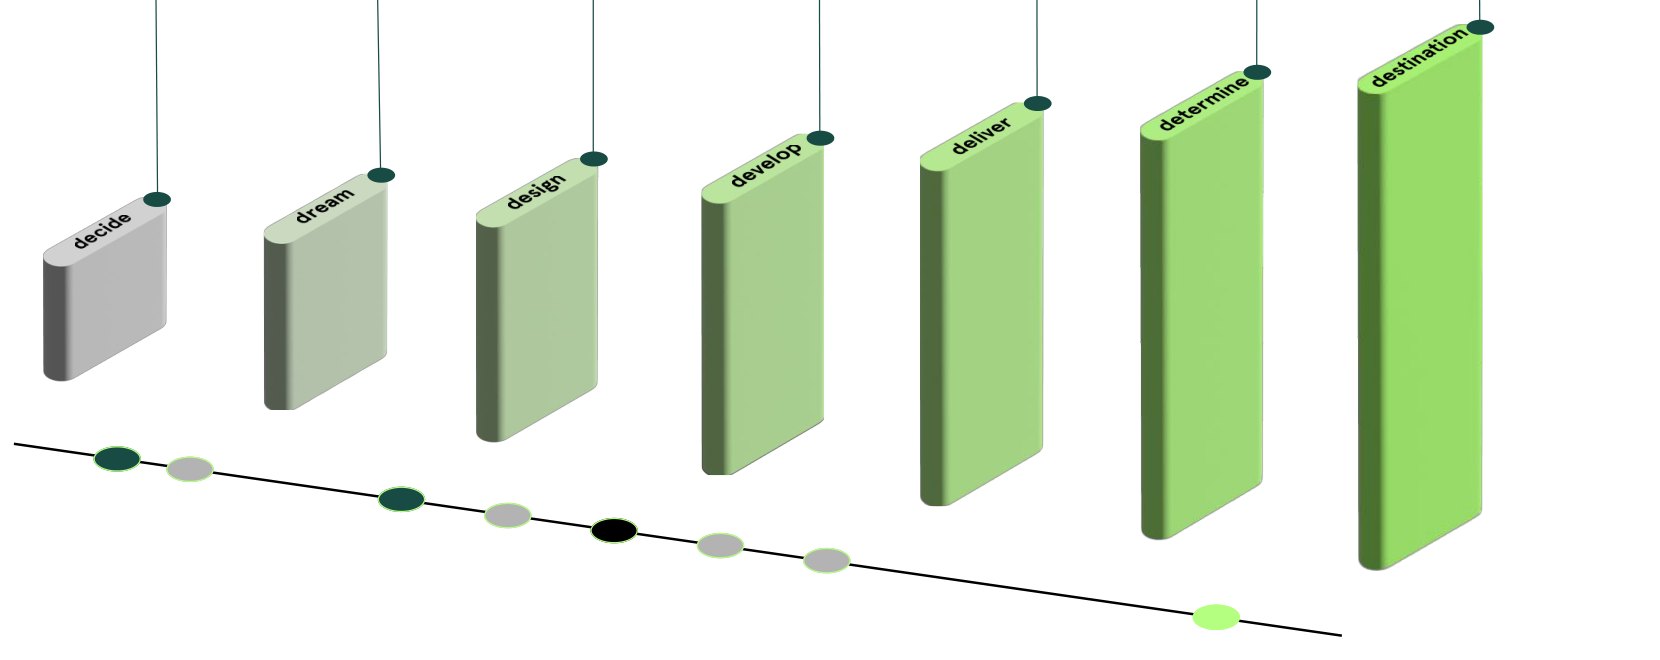
Seven challenge stages rising from decide to destination

decide

Informd aligns with the curriculum, schedules webinars and briefs students, who form groups and register.

dream

Research, problem areas and system gaps; concepts to set direction.

design

Define viability, feasibility and how to build the idea.

develop

Validate through testing and prototyping in real scenarios.

deliver

Final pitch; informd announces the winning group.

determine

The winning idea’s future, based on potential, viability and gains.

destination

Aftermath and payoffs of implementation.

Skills acquired

Research · Ideation · Validation · Building · Sharing

Format

1–2 hour instructional webinars
1-hour cohort team + instructor 1:1 guidance
Winning team reward or CTM decision

Who’s involved

Universities, municipalities, businesses, press & media and external collaborations.

Path to scale

Two state launches, one path to national scale.

California starts with a San Francisco pilot. Arizona starts with a year of research and design in Maricopa County, then a pilot in 2028.
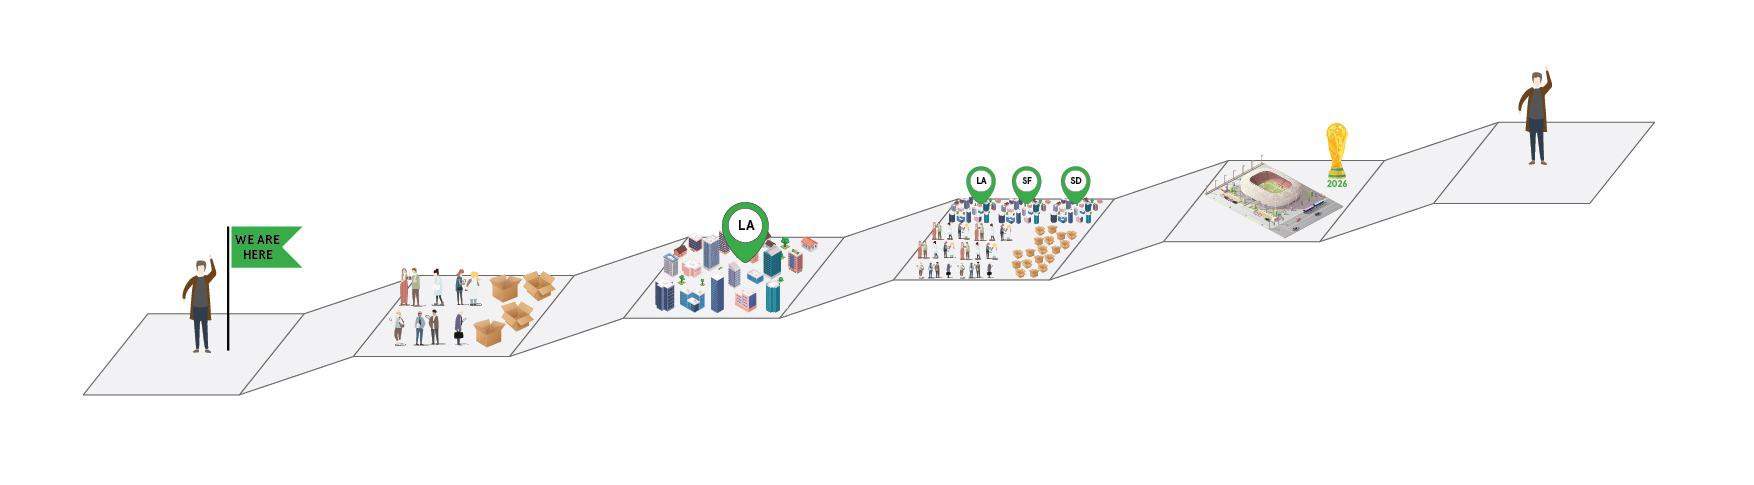
Isometric path rising from today to three years: a launch flag, pilot customers and boxes, Los Angeles, three regional hubs, a stadium, and scale
20+pilot customers in 6 months
2.5ktons of material sourced in 6 months
15ktons of cardboard repurposed in 18 months
$2Mrevenue in 18 months

TargetsCalifornia pilot goals, not results yet.

California

Today

Launch

  • Launch pilot / SF
  • Secure sponsor
  • Identify “value chain” partners
6 months

Pilot

  • 20+ pilot customers
  • 2.5k tons of material sourced
  • University challenge
12 months

Expand

  • Launch in LA / scale
  • New product concepts
  • Secure bulk waste contractors
  • Partners: restaurants, grocery stores, sustainable brands
18 months

Grow

  • 15k tons of cardboard repurposed
  • 100+ customers
  • 3 regional hubs
  • $2M in revenue
  • Corporate brand partners secured
3 years

Scale

  • New products
  • Community impact
  • Ready to scale domestically

Arizona · Maricopa County

2027 · Q1

Map

  • App architecture
  • Cardboard flow mapping
  • ASU / Thunderbird research kickoff
2027 · Q2

Build

  • Dashboard and scorecards
  • Technical specifications drafted
2027 · Q3

Test

  • User testing
  • Municipal data integration
  • Circular workflow finalised
2027 · Q4

Blueprint

  • Pilot blueprint and partners
  • Community showcase
2028

Pilot

  • Maricopa County pilot launch
  • Local micro-manufacturing partners
Working withArizona State UniversityThunderbird School of Global ManagementCity of Phoenix (in discussion)

University challenge

Launch of design challenge with universities and corporate partners
Design contest winners announcement
Launch of the new concepts
Launch of new design contest to embrace new materials
Design challenge turns into an independent activity
informd
Why us?

Design-led, hyperlocal, transparent, collaborative.

Design-led innovation

Transforming waste materials into architectural, infrastructural and product solutions.

Hyperlocal circularity

Keeping materials within the community, reducing transport emissions and creating local economic opportunities.

Material transparency

Data-driven tracking and impact reporting to validate the sustainability of urban-mined resources.

Collaborative ecosystems

Partnering with architects, urban planners and policymakers to embed circular materials into city planning.

Team

The team behind transformd.

Global design and circular-economy expertise, with an Arizona team rooted in ASU and Thunderbird.
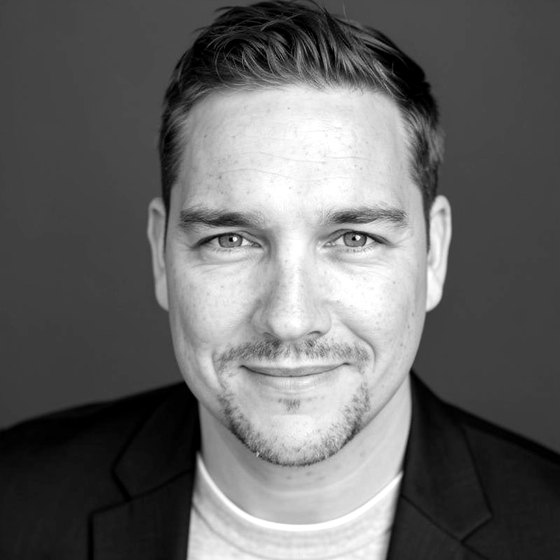
Joseph Oliver

Joseph Oliver

Founding Partner

Valentina Anania

Valentina Anania

Head of Built Environment

Emilio Lonardo

Emilio Lonardo

Chair, University Design Challenge

Brian Ward

Brian Ward

Industrial Design Advisor

Mukul Krishna

Mukul Krishna

Head of Strategy & Corporate Partnerships

Arizona · ASU / Thunderbird

Rachel Benoit

Rachel Benoit

Project Manager, Strategic Accounts

Arizona
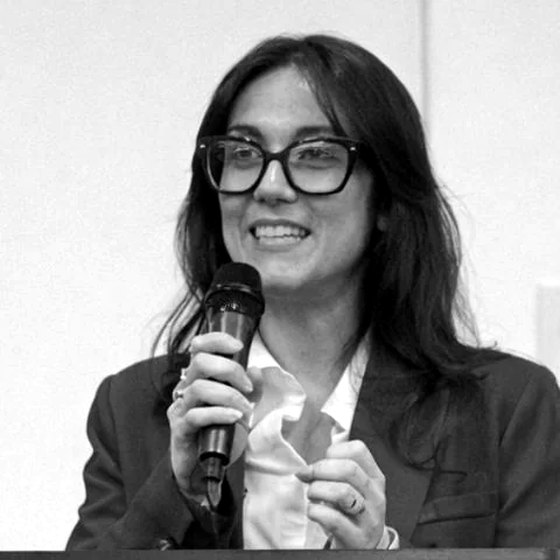
Laura Carucci

Laura Carucci

Project Management Intern

Arizona

Transformwaste
into value

For cities

Bring transformd to your city

  • Diversion and contamination data by zip code
  • Cleaner streets and less illegal dumping
  • Regeneration of disused buildings and new local jobs
Talk to us about your city
For retailers

Join the retail pilot

  • Free cardboard pick-up from your stores
  • Local paper bags and packaging at lower cost
  • Volumes and impact you can report
Join the retail pilot
For universities & partners

Design what comes next

  • A real brief for the university design challenge
  • New products and materials from recovered fibre
  • Sponsorship and value-chain partnerships
Partner with us

Or write to info@informd.life